

Posted by DESIGN Cebu Admin
November 15, 2021
Data is the basis of all information that allow us to analyze, synthesize and strategize so we are better able to create value in the long term. Unfortunately, baseline data in the Philippines needs a lot of improvement. However, the good news is that there are currently numerous industry mapping initiatives currently being undertaken by various national government agencies and offices.
The biggest challenge we encountered while preparing for Cebu’s 2019 bid to be designated as a UNESCO City of Design was the quality and quantity of data sources to be able to estimate the total value contribution of the creative industries to the city’s economy. We scoured various sources that included the LGU, PEZA, DTI, SEC and industry value chains. Thus, we were able to come up with best guestimates that were consistent with worldwide approximations. Please note that these numbers are based on the entire Cebu province as the Philippine Statistics Authority where we sourced the GDP figures does not publish data at the city-level.
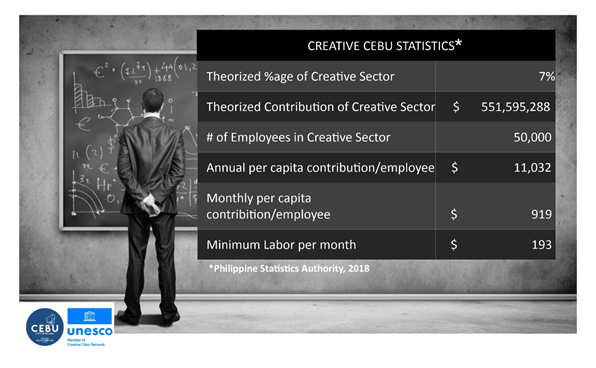
While we had a theorized size of Cebu’s creative industries in 2019, we did not have any breakdowns as to what each of the many disciplines that comprise the city’s creative ecosystem contribute to the total. The lockdowns of 2020 proved to be an opportune time to build on the baseline data and improve our understanding of the creative landscape. We also took that opportunity to effort to probe the impact of the COVID-19 pandemic on the creative industries and their different impacts.
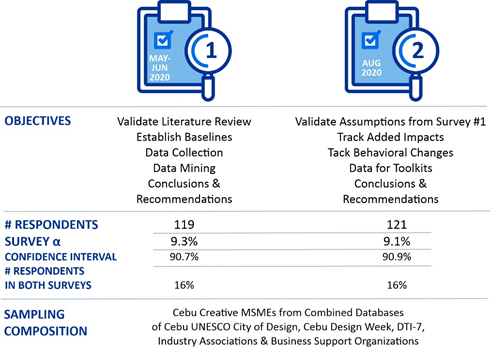
Two surveys were conducted in May and August, 2020, respectively. Results of the surveys were used to track the impact of the pandemics on the sub-sectors. Both surveys had very similar sample sizes and α values or significance levels meaning the confidence interval (1- α) were about 91% which, in these times of uncertainty, is already a very respectable percentage. These samples sizes also represent just a little under 10% of the estimated 1,300 Creative MSMEs in Cebu.
Both surveys were circulated to Cebu-based MSMEs included in the databases of the Cebu UNESCO City of Design, Cebu Design Week, Creative Industry Associations and Business Support Organizations and the database of the Department of Trade and Industry for region seven. The second survey was also sent to all the respondents from the first effort. 16% of MSMEs interviewed responded to both surveys.
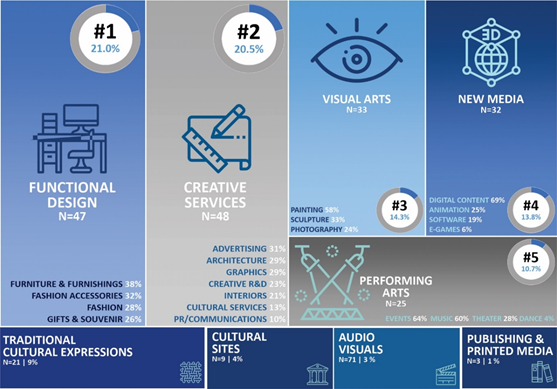
After years of speculation, the surveys gave us a much better picture of the composition of Cebu’s Creative Ecosystem. With its long tradition of manufacturing, it is understandable that Functional Design should constitute the largest group. However, as the economy made a big shift to the service sector, Creative Services now competes for the top spot. Visual Arts is currently the 3rd largest group but we would not surprised if New Media overtakes them very soon, if it has not done so already. Sadly, Publishing & Printed Media is at the bottom of the pile which should come as no surprise as that sub-sector was amongst the first to fall victim to the digitization phenomenon.
The surveys also allowed us to validate certain assumptions and gain a better understanding of the unique dynamics of each subsector.
Incidence of Freelancers and Multiple Job Holding in Cebu’s Creative Sectors
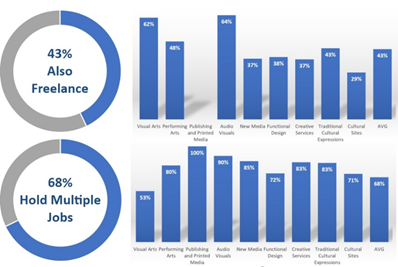
Source: Cebu UNESCO City of Design Survey, May/June 2020 and August 2020
Sales Decrease and Severity During Lockdowns
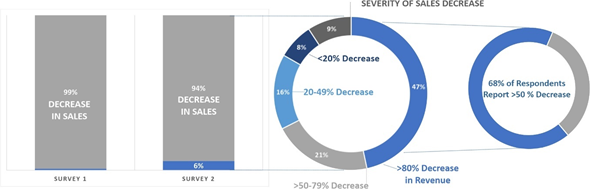
Source: Cebu UNESCO City of Design Survey, May/June 2020 and August 2020
Online Profile of Cebu’s Creative Sectors
Source: Cebu UNESCO City of Design Survey, May/June 2020 and August 2020
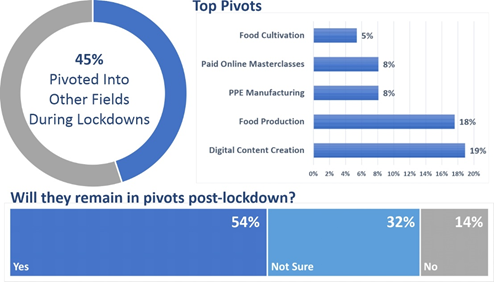
Pivot Profile While on Lockdown
Source: Cebu UNESCO City of Design Survey, August 2020
Another key feature of the second survey was a set of eight questions that were designed to assess the risk impact of COVID-19 on creative MSMEs based on a few parameters that became key issues during the pandemic. The respondents were asked to answer on a linear Likert Scale and their simple averages were calculated to determine the respective scores. These results were then consolidated by sub-sector to arrive at an overall sub-sector risk profile.
Overall Results and Risk Impact Analysis
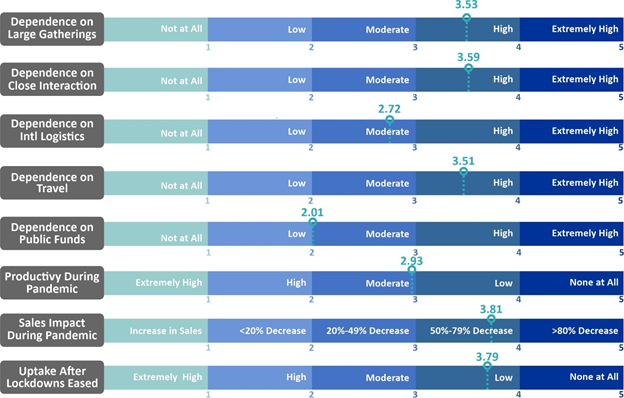
If the vulnerability of creative MSMEs in the creative sector would only be assessed on reduced revenues, there could be a high degree of vulnerability found However, if the assessment could be undertaken at the sub-sector level, it is worth noting that some sub-sectors, particularly the New Media sub-sector, actually fared well during the lockdowns which could have mitigated the of the pandemic on the entire creative industries. Assessment at the sub-sectoral level could also explain the varied performance of different sub-sector in response to the COVID-19 pandemic.
Sub-Sectoral Risk Impact
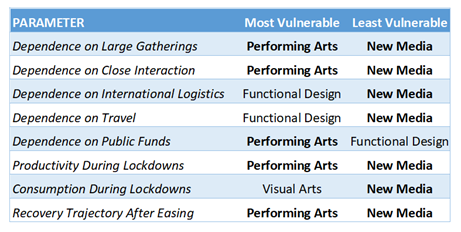
It is understandable that performing arts sub-sector is the most vulnerable among MSMEs in the creative industries. Most of the COVID-19 risk factors are highly present in their business areas, such as dependence on large public gatherings, close interactions and demands for travel. The functional design sub-sector appears vulnerable because they are the most reliant on international supply chains whether it is to import raw materials or export their goods. Their business also relies considerably on traveling in terms of meeting with clients, suppliers and business partners. The visual arts sub-sector suffered the lowest consumption during the lockdowns as most consumers prioritized to invest their resources in the essentials, where visual arts products are not included.
The new media sub-sector becomes the least vulnerable of all the creative sub-sectors, because of their high exposure to the digital space and online activities even before the pandemic. It is interesting to note some start-ups in this sub-sector report little influence or even business growth during the pandemic.
In the August survey, respondents were also asked to indicate their business uptake. A majority (88%) reported only moderate, little or none at all. Despite this slow restart, most of those interviewed are still optimistic. When asked when they expect their revenue streams will return to pre-COVID levels, 85% expressed they will return to normal by the end of 2021.
Demand Uptake and Expected Recovery
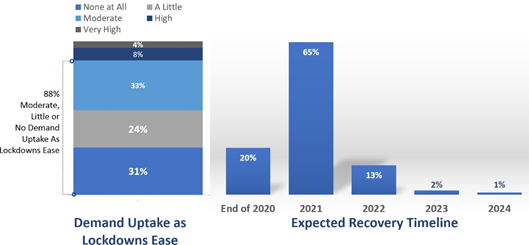
Source: Cebu UNESCO City of Design Survey, August 2020
We already flagged this optimism last year as a cause for concern so are not surprised that a full recovery by the end of 2021 is just a pipe dream.
We will continue strive to improve our data and understanding on the Cebu’s creative subsectors and will update this section accordingly. In the meantime, here are links to other data sources that could be useful to those who need to conduct more research:
Philippine Statistics Authority
https://psa.gov.ph/
Trademap – International Trade Statistics
https://www.trademap.org/Index.aspx
The World Bank
https://data.worldbank.org/
United Nations Commission on Trade and Development
https://unctad.org/statistics